Westmeyer Lab Napari Plugin Homepage
Documentation for Westmeyer Lab Napari plugin.
Napari Plugin Guide
This guide provides step-by-step instructions on how to use the Napari plugin to process and analyze images in a Jupyter notebook.
Installation
- Setup:
- Head over to repository page and download the code: WLab_Napari.ipynb.
- (Suggested) Create a new environment using conda and the napari.yml file from the repository page. See how to create a new conda environment from .yml file here.
- Run the cells “Imports” and “Functions and Napari Window” to open napari Window.
- Install Required Plugins:
- Before starting, ensure that you have
cellpose-napariandpystackreginstalled. - Go to the Napari
Pluginsmenu, search for these plugins, and install them. - Once the installation is complete, restart Napari to apply the changes.
- Before starting, ensure that you have
Example Pipeline for Image Analysis and Processing
- Launch Napari:
- Run the imports and Napari window section of the code in your Jupyter notebook to open Napari.
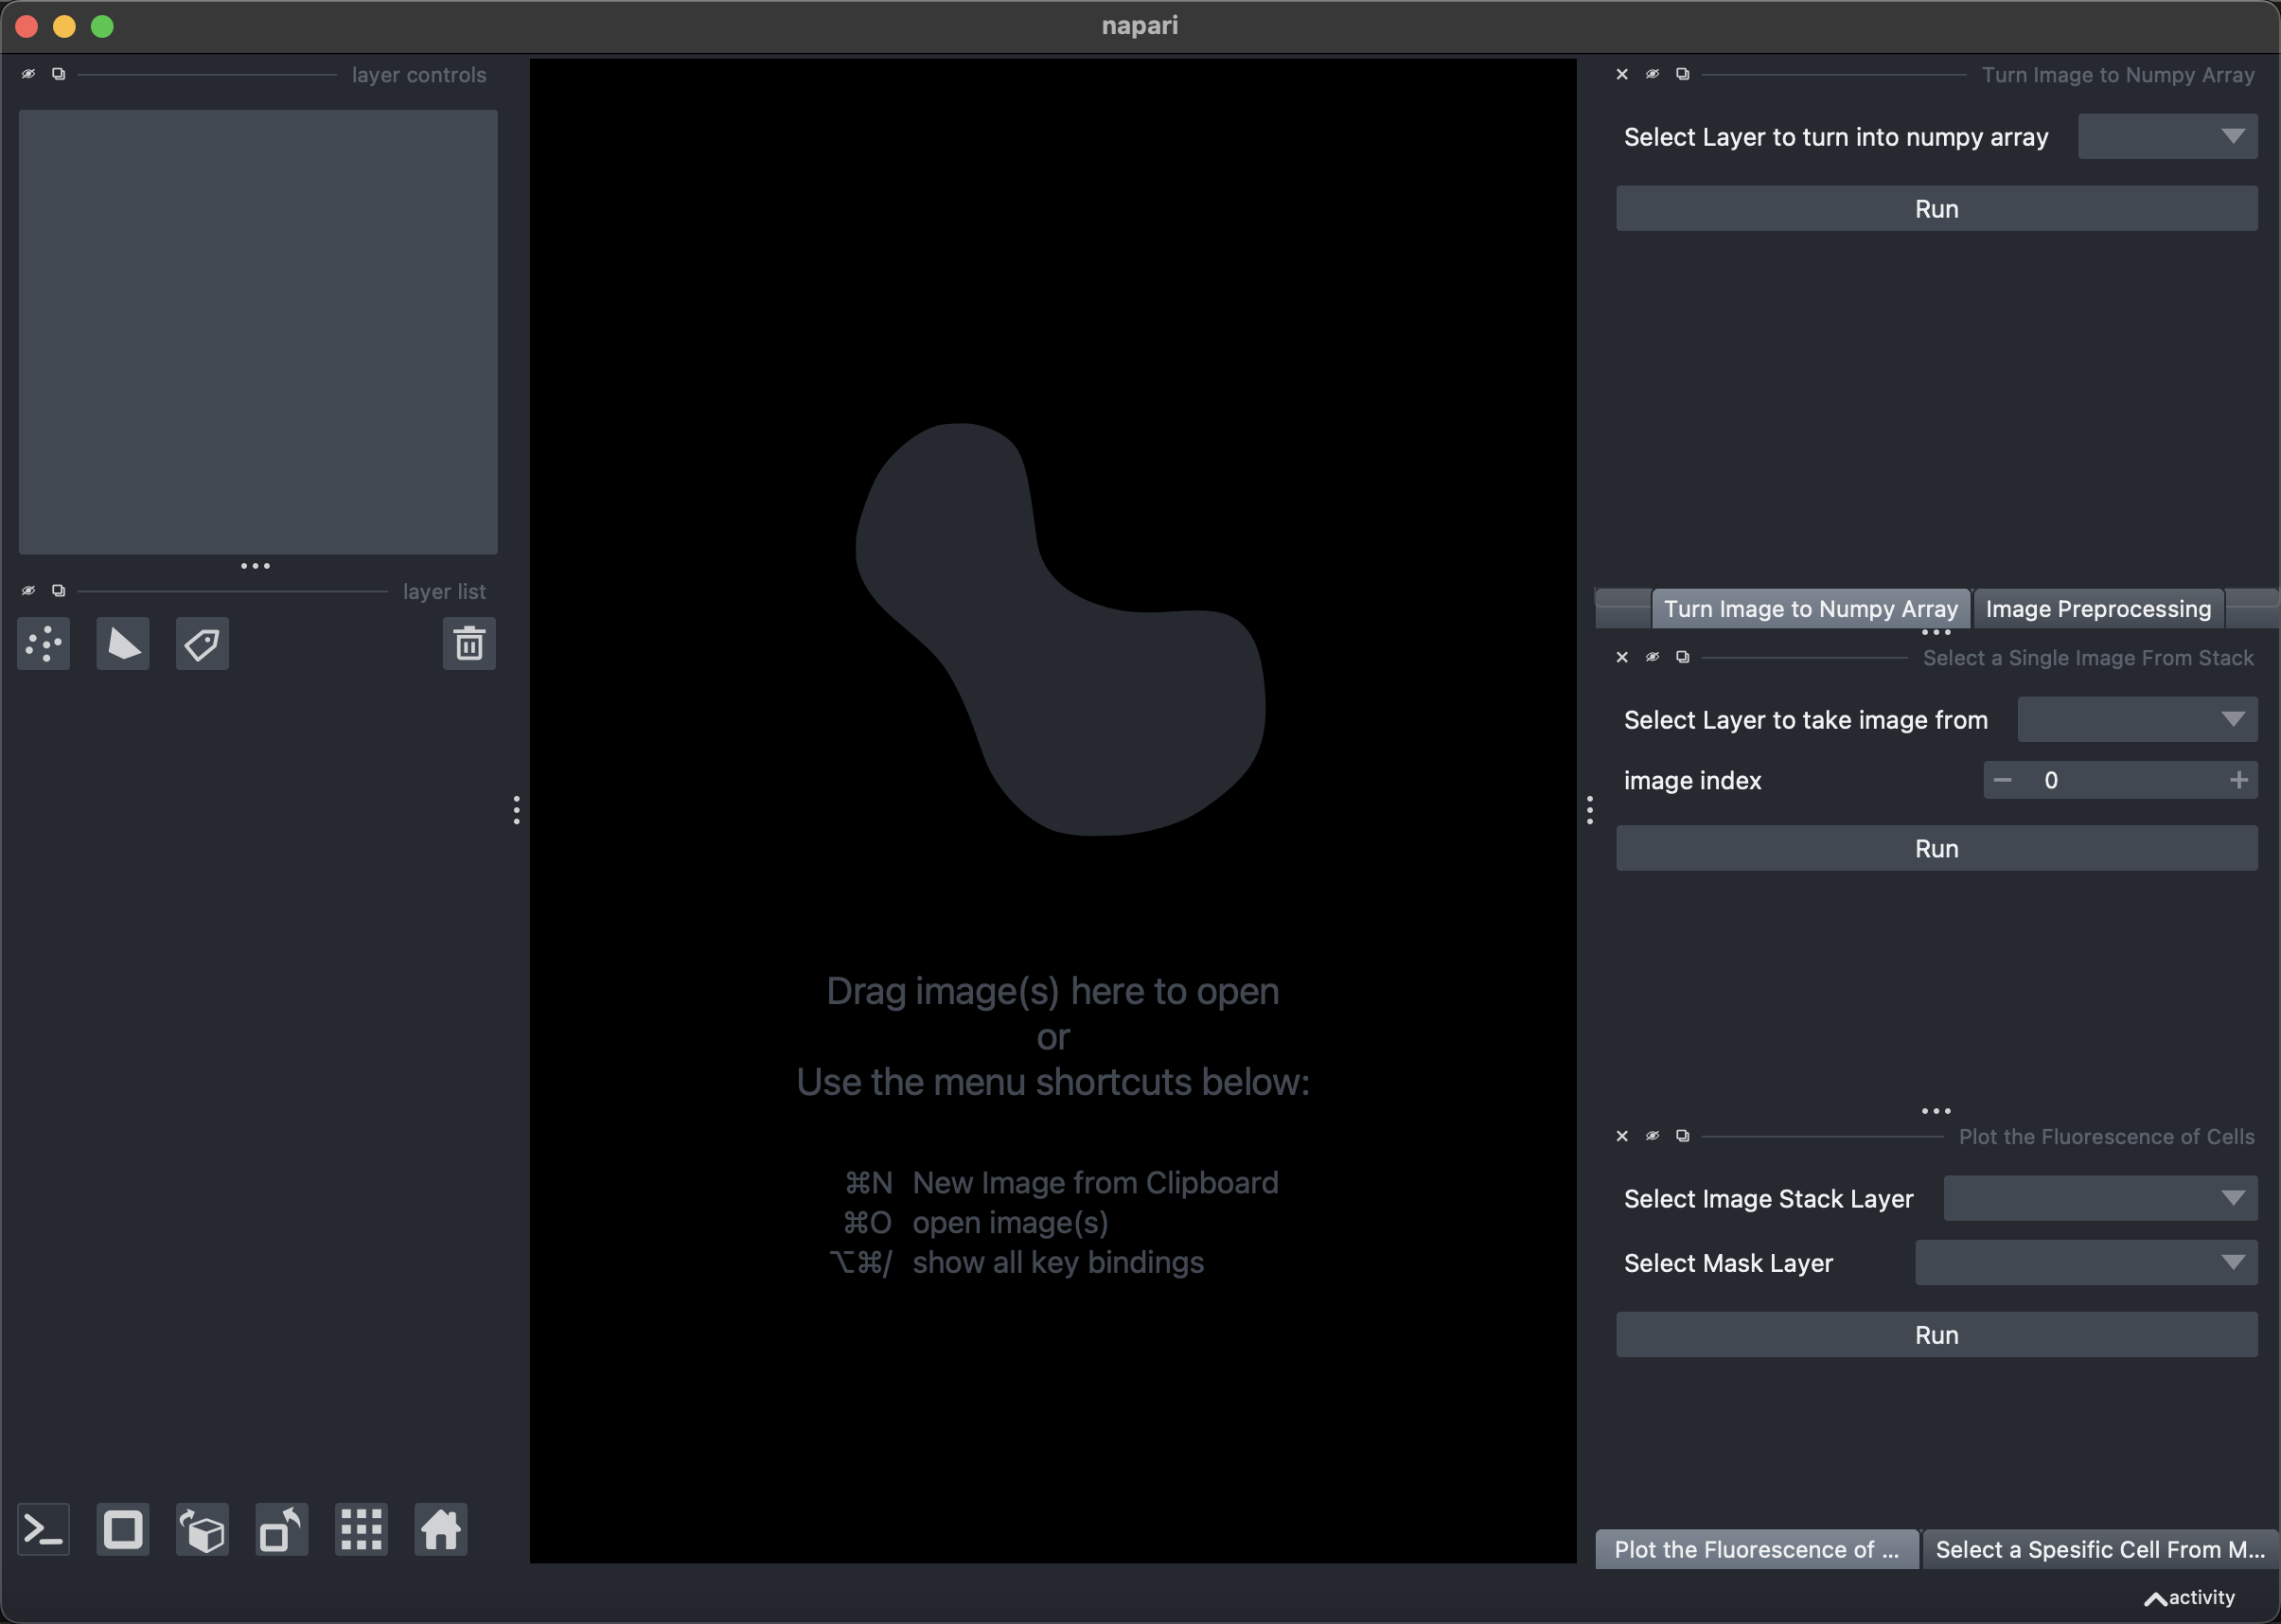
- Run the imports and Napari window section of the code in your Jupyter notebook to open Napari.
- Import Image Folder:
- Go to the top menu in Napari and select
File > Open Folder. - Choose the folder containing your images.
- Go to the top menu in Napari and select
Optional: Organizing Image Outputs
- (Optional) Run Merge and Move Widgets:
- If you wish to use the “Merge images” and “Move images” widgets to organize images outputted by CX07, you can run the separate cell in the notebook.
- This step is to organize images taken from CX07 microscope and can be skipped if not needed.
- You can close these widgets once you’ve completed organizing the images.
Preparing Images for Processing
- Convert Images to Numpy Arrays:
- Select the image layer in the third widget.

- Click the button to convert the selected image layer into a Numpy array.
- The output will be a new layer containing the Numpy array.
Image Processing and Analysis
- Select the image layer in the third widget.
- Use PyStackReg:
- From the Napari
Pluginsmenu, add the PyStackReg plugin if you haven’t already done so. You can find more information about the plugin here. - In the PyStackReg widget, select the Numpy array layer and click on
Register and Transform. - This will create a new registered layer.
- From the Napari
- Apply Image Processing:
- Move to the Image Processing tab next to Numpy widget.
- Select the registered Numpy array layer as input (or the Numpy layer if registration sstep was skipped).
- Choose the desired operations and press
Run. - The output will be a new processed image layer.
Segmentation and Analysis
- Perform Segmentation with Cellpose:
- To learn how to use the plugin visit here
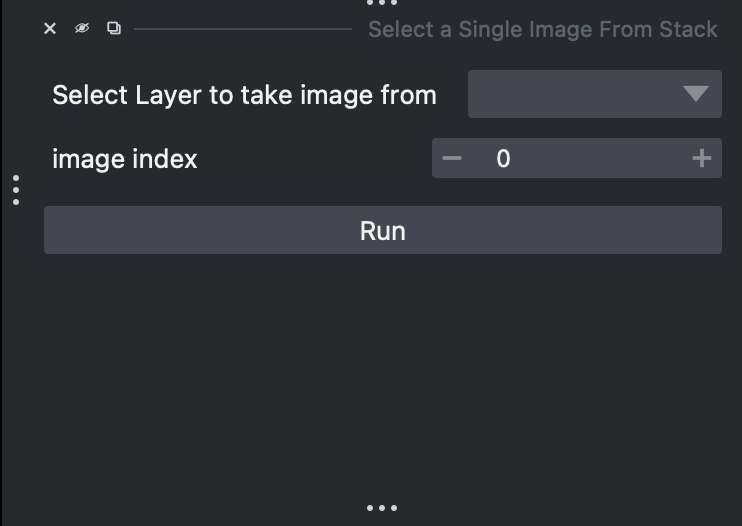
- Select the processed image layer and extract a single image using the select single image widget or provide a mean image of multiple frames. Because cellpose will segment a single image to produce mask.
- Go to the
Pluginsmenu and select Cellpose. - It is suggested to drag the Cellpose widget to make it a floating window.
- Select the single image layer
- Run segmentation on the single image layer.
- The output will be displayed in new layers.
- Plot Intensity:
- Select the image layer you wish to analyze (e.g., Processed Image layer) in the plot fluorescence widget. This layer should contain multiple images to get fluorescence over time.
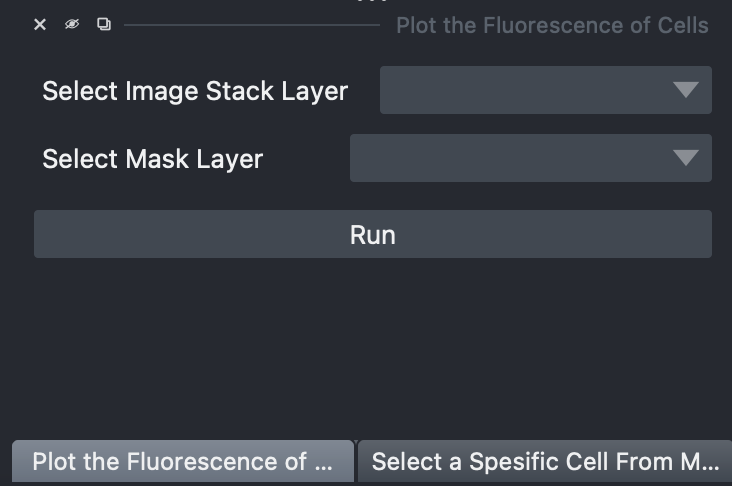
- Choose the mask provided by Cellpose.
- Click
Runto generate a plot of intensities in the jupyter notebook. - The plot will be outputted in the Notebook, below the last executed cell.
- Select the image layer you wish to analyze (e.g., Processed Image layer) in the plot fluorescence widget. This layer should contain multiple images to get fluorescence over time.